
Why starting hand charts matter and when to rely on them
When you’re learning poker or trying to tighten your preflop strategy, starting hand charts are one of the fastest ways to improve. A starting hand chart condenses complex probability and game-theory ideas into a simple visual guide that tells you which hands to play from each seat. If you want to make fewer mistakes, save chips, and build a foundation for postflop thinking, you use charts as a reference until you internalize the ranges.
You should use a chart differently depending on your goals. For example:
- If you’re practicing, use a strict, conservative chart to avoid speculative plays that confuse your learning.
- If you’re aiming for exploitative profit at a live table, adjust your ranges to the tendencies of your opponents (loose, tight, passive, aggressive).
- In deep-stack cash games you can widen your range for speculative suited connectors; in short-stack tournament spots you should tighten up and favor stronger high-card hands.
How position changes which hands you should open
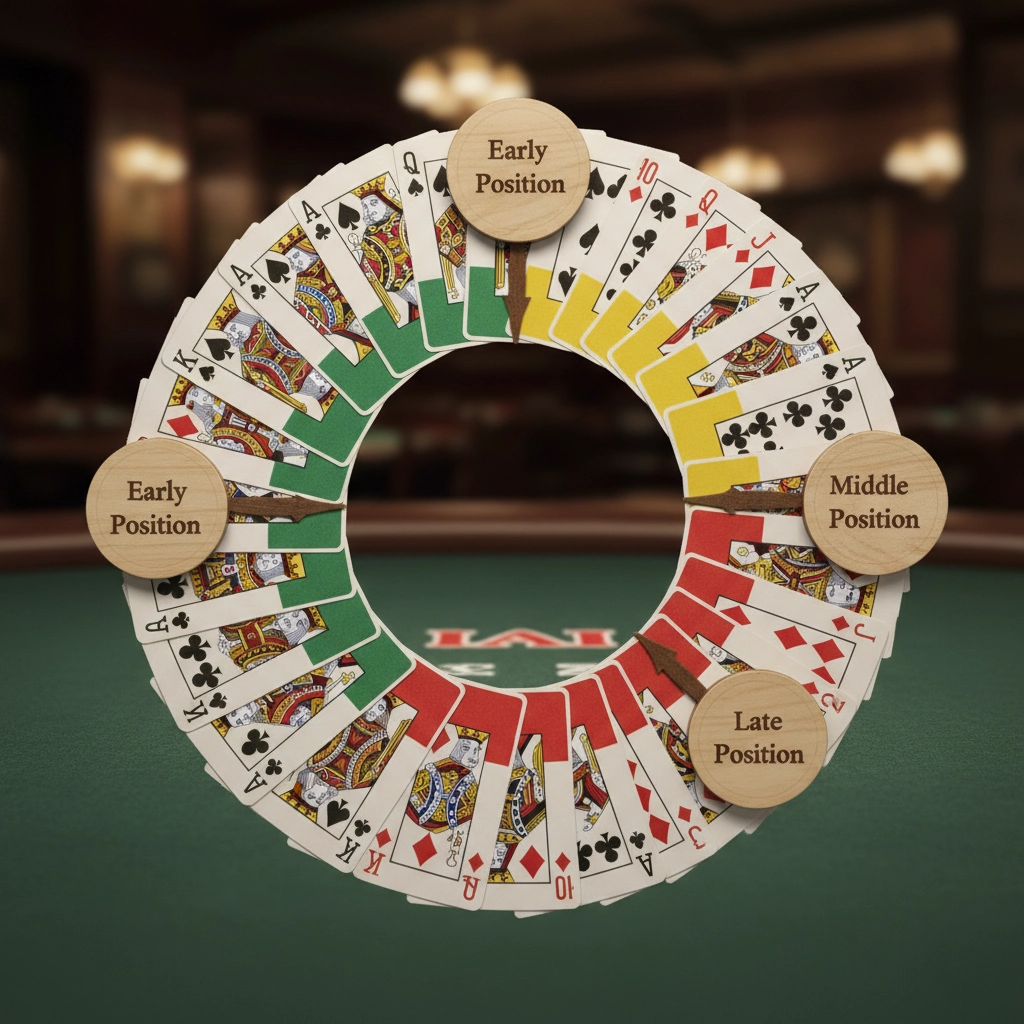
Position is the single biggest factor that changes a hand’s value. The later you act, the more information you have, and the more hands become playable. Understanding this lets you read a chart as a sliding scale rather than a fixed rule: early positions demand premium hands, middle positions allow a few more contenders, and late positions let you play a wide variety profitably.
Quick position-based rules of thumb
- Early position (UTG, UTG+1): Play tightly. Favor high pocket pairs (AA–QQ), strong broadways (AK, AQ), and occasionally JJ/TT depending on table dynamics.
- Middle position: Add more suited broadways (KQs, QJs), mid pocket pairs (99–88), and select suited connectors (T9s) if stacks are deep.
- Late position (cutoff, button): Open a wide range: Axs, many broadways, suited connectors and one-gappers. You can also raise lighter to steal blinds.
- Blinds: Defend selectively. Defending the small blind requires tighter consideration because you act first postflop; the big blind can defend more broadly when pot odds are favorable.
Charts typically express ranges in percent (e.g., 15% of hands from cut-off) or by specific hand categories: pocket pairs, suited hands (s), and offsuit hands (o). Learning the notation—22-AA, AKo, KQs, 76s—lets you translate a chart into actions at the table.
One practical tip: start by memorizing the difference in ranges between three seat-groups (early, middle, late) then refine to specific seats. Also adjust charts for table size (6-max vs full ring) and your stack depth—short stacks reduce the value of speculative hands.
With that positional framework in mind, the next section will break down concrete starting hand charts and show you example ranges and how to apply them in real preflop situations.
Concrete opening ranges you can use (full-ring and 6‑max examples)
Seeing numbers and hand lists will make charts usable at the table. Below are two practical example sets — one for a full‑ring (9-handed) game and one for 6‑max — that you can start with and adjust later. These are not gospel but sensible baselines that match the positional principles already covered.
Full‑ring (9 players) — example opening ranges
– UTG (early) — ~10%: 66+, AQs+, AKo, AQo, KQs
– MP (middle) — ~15%: 55+, AJs+, ATo+, KQs, QJs, JTs, T9s
– CO (cutoff) — ~25%: 22+, A2s+, AJo+, KTs+, QTs+, JTs, 98s, 87s
– BTN (button) — ~40–50%: 22+, A2s+, A2o+, K9s+, KTo+, Q9s+, QTo+, many suited connectors and one‑gappers (e.g., 65s–JTs)
– SB (small blind, vs unopened) — defend/raise ~30–40% depending on opponents: tighter than button because of first to act postflop
– BB (big blind) — defend wider because of pot odds; calling range depends on opener
6‑max (6 players) — example opening ranges
– EP (UTG) — ~15%: 77+, ATs+, AJo+, KQs, QJs
– MP/CO — ~25%: 55+, A9s+, ATo+, KTs+, QTs+, JTs, 98s, 87s
– BTN — ~45–55%: nearly any Ace, most suited broadways, suited connectors down to 54s, broad offsuit connectors like KTo+
– SB/BB — defend similarly to full‑ring but expect more steal attempts; SB should be cautious postflop
How to use these lists: mentally map them to percentages (UTG ~10–15%, cutoff ~20–30%, button ~40–50%). When you sit down, pick one baseline (full‑ring vs 6‑max), memorize the three seat groups (early/middle/late) and the button/blind specifics. Over time, expand the lists to individual seats.
Responding to raises: calling, 3‑betting, and folding with chart guidance
A starting hand chart is most useful when it helps you respond to aggression. Preflop reactions fall into three actions: fold, call (or flat), and 3‑bet. Use ranges to keep you consistent and avoid emotionally-driven calls.
Basic response rules
– Versus early position opens: tighten. Call or 3‑bet with stronger hands because the opener is likely strong. Example: flat with mid pairs (66–99) and suited broadways; 3‑bet for value with JJ+/AQ+ and occasionally KQs.
– Versus late position opens (CO/BTN): widen your defend and 3‑bet ranges. You can 3‑bet lightly from the blinds with polarized ranges (value + some equity bluffs). Example BB vs BTN open 3‑bet ~8–12%: value 88+, AQ+, KQs; add bluffs like A5s, A4s, suited connectors.
– Multiway action: avoid fancy calls. If multiple players are entering, fold marginal hands that rely on heads‑up postflop play (e.g., weak offsuit broadways, low suited connectors without cutters).
Sample 3‑bet structure
– Light 3‑bet (to apply pressure / steal pots): include blockers and hands with playability — suited Aces, KQs, occasional suited connectors. Keep this portion small and position‑dependent.
– Value 3‑bet: prioritize high equity and fold equity hands (QQ+, AK). Size 3‑bets larger vs loose callers, smaller vs tight opponents.
Practical chart tip: create two layers — a defend/call chart and a 3‑bet chart for each seat versus different openers. Train them separately: one set for defending blinds vs steals, another set for making 3‑bets in position and out of position.
Adjusting charts by stack depth and opponent type
Charts are starting points; the two biggest real‑time adjustments are stack size and opponent tendencies.
Stack depth adjustments
– Deep stacks (100bb+): widen with speculative hands that can make big pots — small pairs, suited connectors (e.g., 76s–JTs). These hands gain fold equity postflop and implied odds.
– Medium stacks (40–80bb): favor hands with straightforward value and playability — broadways and mid pairs. Reduce limp/call frequency.
– Short stacks (<40bb): tighten and shift toward high‑card hands and pairs that hold up in all‑in scenarios. Remove marginal suited connectors and low pairs from open/defend charts.
Opponent adjustments
– Versus very tight opponents: open and 3‑bet a bit more; steal more frequently from the cutoff/button.
– Versus very loose/passive opponents: value‑bet and 3‑bet stronger hands; avoid bluff‑heavy lines that rely on folds.
– Versus aggressive 3‑bettors: tighten your opening ranges and respond with a polarized 3‑bet range or call and play postflop with hands that flop well.
Keep a simple note on your chart: a one‑line adjustment for stack depth and one for opponent type. That small habit will make your chart both practical and adaptable at the table.

Practice drills and tools to lock in ranges
Turn theory into habit with short, focused practice sessions. Use these drills to make chart-based decisions automatic and to refine your instincts.
- Range memorization: pick one baseline (full‑ring or 6‑max) and spend 10–15 minutes daily quizzing yourself on the three seat groups (early/middle/late) until you can state percentages and core hands without thinking.
- Preflop-only sessions: play short sessions where you only act on preflop decisions — open, fold, call, 3‑bet — to reinforce charts under pressure.
- Review and adjust: after each session, mark hands where you deviated and note the reason (stack, opponent, mistake). Adjust your chart notes accordingly.
- Use software sparingly: equity calculators and range trainers (Equilab, GTO+ or solvers) help validate adjustments, but start with simple charts before diving into solver outputs.
- Track outcomes: log hands for which you followed or broke the chart; look for patterns that indicate necessary long‑term adjustments rather than one-off tilts.
Next steps: practice, adapt, iterate
Make a plan: pick a baseline chart, practice it in short, regular sessions, and review results with an open mind. Charts are living tools — they guide consistent, rational preflop play but should evolve as your reads, game format, and stack dynamics change. Commit to small, measurable improvements and the charts will amplify your wins rather than replace your judgment. For deeper study and example ranges, reputable resources and courses can help you bridge the gap between charts and in‑game adjustments — for instance, see Upswing Poker for structured lessons and drills.
Frequently Asked Questions
How quickly should I move from using charts to relying on instincts?
There’s no fixed timeline. Many players need a few weeks of deliberate practice and hundreds of hands to internalize basic ranges. Focus on consistent, correct decisions first; instincts develop as you repeatedly apply charts and review outcomes. When you can explain why you opened or defended a specific hand in most spots, you’re ready to rely more on judgment.
When is it correct to deviate from a starting hand chart?
Deviations are appropriate when you have strong, exploitable information: extreme opponent tendencies (very tight or very loose), abnormal stack depths, or table composition (short‑stacked table, bubble pressure). Deviate only with a clear objective (steal, exploit, avoid marginal postflop) and revert to baseline ranges when conditions normalize.
Do starting hand charts differ between cash games and tournaments?
Yes. Tournament play often requires tighter early ranges and more shove/fold thinking as stacks shorten and ICM considerations arise. Cash games permit wider speculative ranges with deep stacks and consistent pot odds. Use charts tailored to the format and adjust for effective stack depth and payout pressure.
Why starting hand charts matter and when to rely on them
When you’re learning poker or trying to tighten your preflop strategy, starting hand charts are one of the fastest ways to improve. A starting hand chart condenses complex probability and game-theory ideas into a simple visual guide that tells you which hands to play from each seat. If you want to make fewer mistakes, save chips, and build a foundation for postflop thinking, you use charts as a reference until you internalize the ranges.
You should use a chart differently depending on your goals. For example:
- If you’re practicing, use a strict, conservative chart to avoid speculative plays that confuse your learning.
- If you’re aiming for exploitative profit at a live table, adjust your ranges to the tendencies of your opponents (loose, tight, passive, aggressive).
- In deep-stack cash games you can widen your range for speculative suited connectors; in short-stack tournament spots you should tighten up and favor stronger high-card hands.
How position changes which hands you should open
Position is the single biggest factor that changes a hand’s value. The later you act, the more information you have, and the more hands become playable. Understanding this lets you read a chart as a sliding scale rather than a fixed rule: early positions demand premium hands, middle positions allow a few more contenders, and late positions let you play a wide variety profitably.
Quick position-based rules of thumb
- Early position (UTG, UTG+1): Play tightly. Favor high pocket pairs (AA–QQ), strong broadways (AK, AQ), and occasionally JJ/TT depending on table dynamics.
- Middle position: Add more suited broadways (KQs, QJs), mid pocket pairs (99–88), and select suited connectors (T9s) if stacks are deep.
- Late position (cutoff, button): Open a wide range: Axs, many broadways, suited connectors and one-gappers. You can also raise lighter to steal blinds.
- Blinds: Defend selectively. Defending the small blind requires tighter consideration because you act first postflop; the big blind can defend more broadly when pot odds are favorable.
Charts typically express ranges in percent (e.g., 15% of hands from cut-off) or by specific hand categories: pocket pairs, suited hands (s), and offsuit hands (o). Learning the notation—22-AA, AKo, KQs, 76s—lets you translate a chart into actions at the table.
One practical tip: start by memorizing the difference in ranges between three seat-groups (early, middle, late) then refine to specific seats. Also adjust charts for table size (6-max vs full ring) and your stack depth—short stacks reduce the value of speculative hands.
With that positional framework in mind, the next section will break down concrete starting hand charts and show you example ranges and how to apply them in real preflop situations.
Concrete opening ranges you can use (full-ring and 6‑max examples)
Seeing numbers and hand lists will make charts usable at the table. Below are two practical example sets — one for a full‑ring (9-handed) game and one for 6‑max — that you can start with and adjust later. These are not gospel but sensible baselines that match the positional principles already covered.
Full‑ring (9 players) — example opening ranges
– UTG (early) — ~10%: 66+, AQs+, AKo, AQo, KQs
– MP (middle) — ~15%: 55+, AJs+, ATo+, KQs, QJs, JTs, T9s
– CO (cutoff) — ~25%: 22+, A2s+, AJo+, KTs+, QTs+, JTs, 98s, 87s
– BTN (button) — ~40–50%: 22+, A2s+, A2o+, K9s+, KTo+, Q9s+, QTo+, many suited connectors and one‑gappers (e.g., 65s–JTs)
– SB (small blind, vs unopened) — defend/raise ~30–40% depending on opponents: tighter than button because of first to act postflop
– BB (big blind) — defend wider because of pot odds; calling range depends on opener
6‑max (6 players) — example opening ranges
– EP (UTG) — ~15%: 77+, ATs+, AJo+, KQs, QJs
– MP/CO — ~25%: 55+, A9s+, ATo+, KTs+, QTs+, JTs, 98s, 87s
– BTN — ~45–55%: nearly any Ace, most suited broadways, suited connectors down to 54s, broad offsuit connectors like KTo+
– SB/BB — defend similarly to full‑ring but expect more steal attempts; SB should be cautious postflop
How to use these lists: mentally map them to percentages (UTG ~10–15%, cutoff ~20–30%, button ~40–50%). When you sit down, pick one baseline (full‑ring vs 6‑max), memorize the three seat groups (early/middle/late) and the button/blind specifics. Over time, expand the lists to individual seats.
Responding to raises: calling, 3‑betting, and folding with chart guidance
A starting hand chart is most useful when it helps you respond to aggression. Preflop reactions fall into three actions: fold, call (or flat), and 3‑bet. Use ranges to keep you consistent and avoid emotionally-driven calls.
Basic response rules
– Versus early position opens: tighten. Call or 3‑bet with stronger hands because the opener is likely strong. Example: flat with mid pairs (66–99) and suited broadways; 3‑bet for value with JJ+/AQ+ and occasionally KQs.
– Versus late position opens (CO/BTN): widen your defend and 3‑bet ranges. You can 3‑bet lightly from the blinds with polarized ranges (value + some equity bluffs). Example BB vs BTN open 3‑bet ~8–12%: value 88+, AQ+, KQs; add bluffs like A5s, A4s, suited connectors.
– Multiway action: avoid fancy calls. If multiple players are entering, fold marginal hands that rely on heads‑up postflop play (e.g., weak offsuit broadways, low suited connectors without cutters).
Sample 3‑bet structure
– Light 3‑bet (to apply pressure / steal pots): include blockers and hands with playability — suited Aces, KQs, occasional suited connectors. Keep this portion small and position‑dependent.
– Value 3‑bet: prioritize high equity and fold equity hands (QQ+, AK). Size 3‑bets larger vs loose callers, smaller vs tight opponents.
Practical chart tip: create two layers — a defend/call chart and a 3‑bet chart for each seat versus different openers. Train them separately: one set for defending blinds vs steals, another set for making 3‑bets in position and out of position.
Adjusting charts by stack depth and opponent type
Charts are starting points; the two biggest real‑time adjustments are stack size and opponent tendencies.
Stack depth adjustments
– Deep stacks (100bb+): widen with speculative hands that can make big pots — small pairs, suited connectors (e.g., 76s–JTs). These hands gain fold equity postflop and implied odds.
– Medium stacks (40–80bb): favor hands with straightforward value and playability — broadways and mid pairs. Reduce limp/call frequency.
– Short stacks (<40bb): tighten and shift toward high‑card hands and pairs that hold up in all‑in scenarios. Remove marginal suited connectors and low pairs from open/defend charts.
Opponent adjustments
– Versus very tight opponents: open and 3‑bet a bit more; steal more frequently from the cutoff/button.
– Versus very loose/passive opponents: value‑bet and 3‑bet stronger hands; avoid bluff‑heavy lines that rely on folds.
– Versus aggressive 3‑bettors: tighten your opening ranges and respond with a polarized 3‑bet range or call and play postflop with hands that flop well.
Keep a simple note on your chart: a one‑line adjustment for stack depth and one for opponent type. That small habit will make your chart both practical and adaptable at the table.
Common mistakes and how to avoid them
Even with a solid chart it’s easy to drift into habits that undo your progress. Common errors include over-relying on a static chart, failing to adjust for stack depth or player types, mis-sizing 3‑bets, and defending the small blind too loosely. Another frequent issue is trying to play speculative hands in short-stack spots where implied odds don’t exist.
- Relying on charts blindly: use them as a baseline, not a substitute for reads. If you have strong live information, adjust deliberately and briefly note the reason.
- Poor bet sizing: inconsistent sizing reduces fold equity and muddles postflop decisions—decide on standard open and 3‑bet sizes per table and stick to them.
- Over-defending the SB: remember you act first postflop; tighten SB defense or mix in 3‑bets instead of calls.
- No review habit: without tracking deviations and outcomes you won’t know which adjustments worked. Review mistakes weekly.
Quick fixes to stop the leak
- Create a short pre-session checklist: table size, effective stacks, big table tendencies, and your baseline chart choice.
- Keep two minimal in-game notes: one for stack-based tweaks and one for opponent-specific adjustments (tight/loose/aggressive).
- Limit the number of manual deviations per session—make each one purposeful and reviewable.
Practice drills and tools to lock in ranges
Turn theory into habit with short, focused practice sessions. Use these drills to make chart-based decisions automatic and to refine your instincts.
- Range memorization: pick one baseline (full‑ring or 6‑max) and spend 10–15 minutes daily quizzing yourself on the three seat groups (early/middle/late) until you can state percentages and core hands without thinking.
- Preflop-only sessions: play short sessions where you only act on preflop decisions — open, fold, call, 3‑bet — to reinforce charts under pressure.
- Review and adjust: after each session, mark hands where you deviated and note the reason (stack, opponent, mistake). Adjust your chart notes accordingly.
- Use software sparingly: equity calculators and range trainers (Equilab, GTO+ or solvers) help validate adjustments, but start with simple charts before diving into solver outputs.
- Track outcomes: log hands for which you followed or broke the chart; look for patterns that indicate necessary long‑term adjustments rather than one-off tilts.
Next steps: practice, adapt, iterate
Make a plan: pick a baseline chart, practice it in short, regular sessions, and review results with an open mind. Charts are living tools — they guide consistent, rational preflop play but should evolve as your reads, game format, and stack dynamics change. Commit to small, measurable improvements and the charts will amplify your wins rather than replace your judgment. For deeper study and example ranges, reputable resources and courses can help you bridge the gap between charts and in‑game adjustments — for instance, see Upswing Poker for structured lessons and drills.
Frequently Asked Questions
How quickly should I move from using charts to relying on instincts?
There’s no fixed timeline. Many players need a few weeks of deliberate practice and hundreds of hands to internalize basic ranges. Focus on consistent, correct decisions first; instincts develop as you repeatedly apply charts and review outcomes. When you can explain why you opened or defended a specific hand in most spots, you’re ready to rely more on judgment.
When is it correct to deviate from a starting hand chart?
Deviations are appropriate when you have strong, exploitable information: extreme opponent tendencies (very tight or very loose), abnormal stack depths, or table composition (short‑stacked table, bubble pressure). Deviate only with a clear objective (steal, exploit, avoid marginal postflop) and revert to baseline ranges when conditions normalize.
Do starting hand charts differ between cash games and tournaments?
Yes. Tournament play often requires tighter early ranges and more shove/fold thinking as stacks shorten and ICM considerations arise. Cash games permit wider speculative ranges with deep stacks and consistent pot odds. Use charts tailored to the format and adjust for effective stack depth and payout pressure.